Drill paths
Drill down, roll up, re-order; the view rebuilds in real time.
Click-to-explore analytics, right in your sheet. Break any total down by channel, product, region: every step a trend over time, every change explained.
The demo is the real product, guided tour included, plus a 260,000-row real dataset to stress-test.
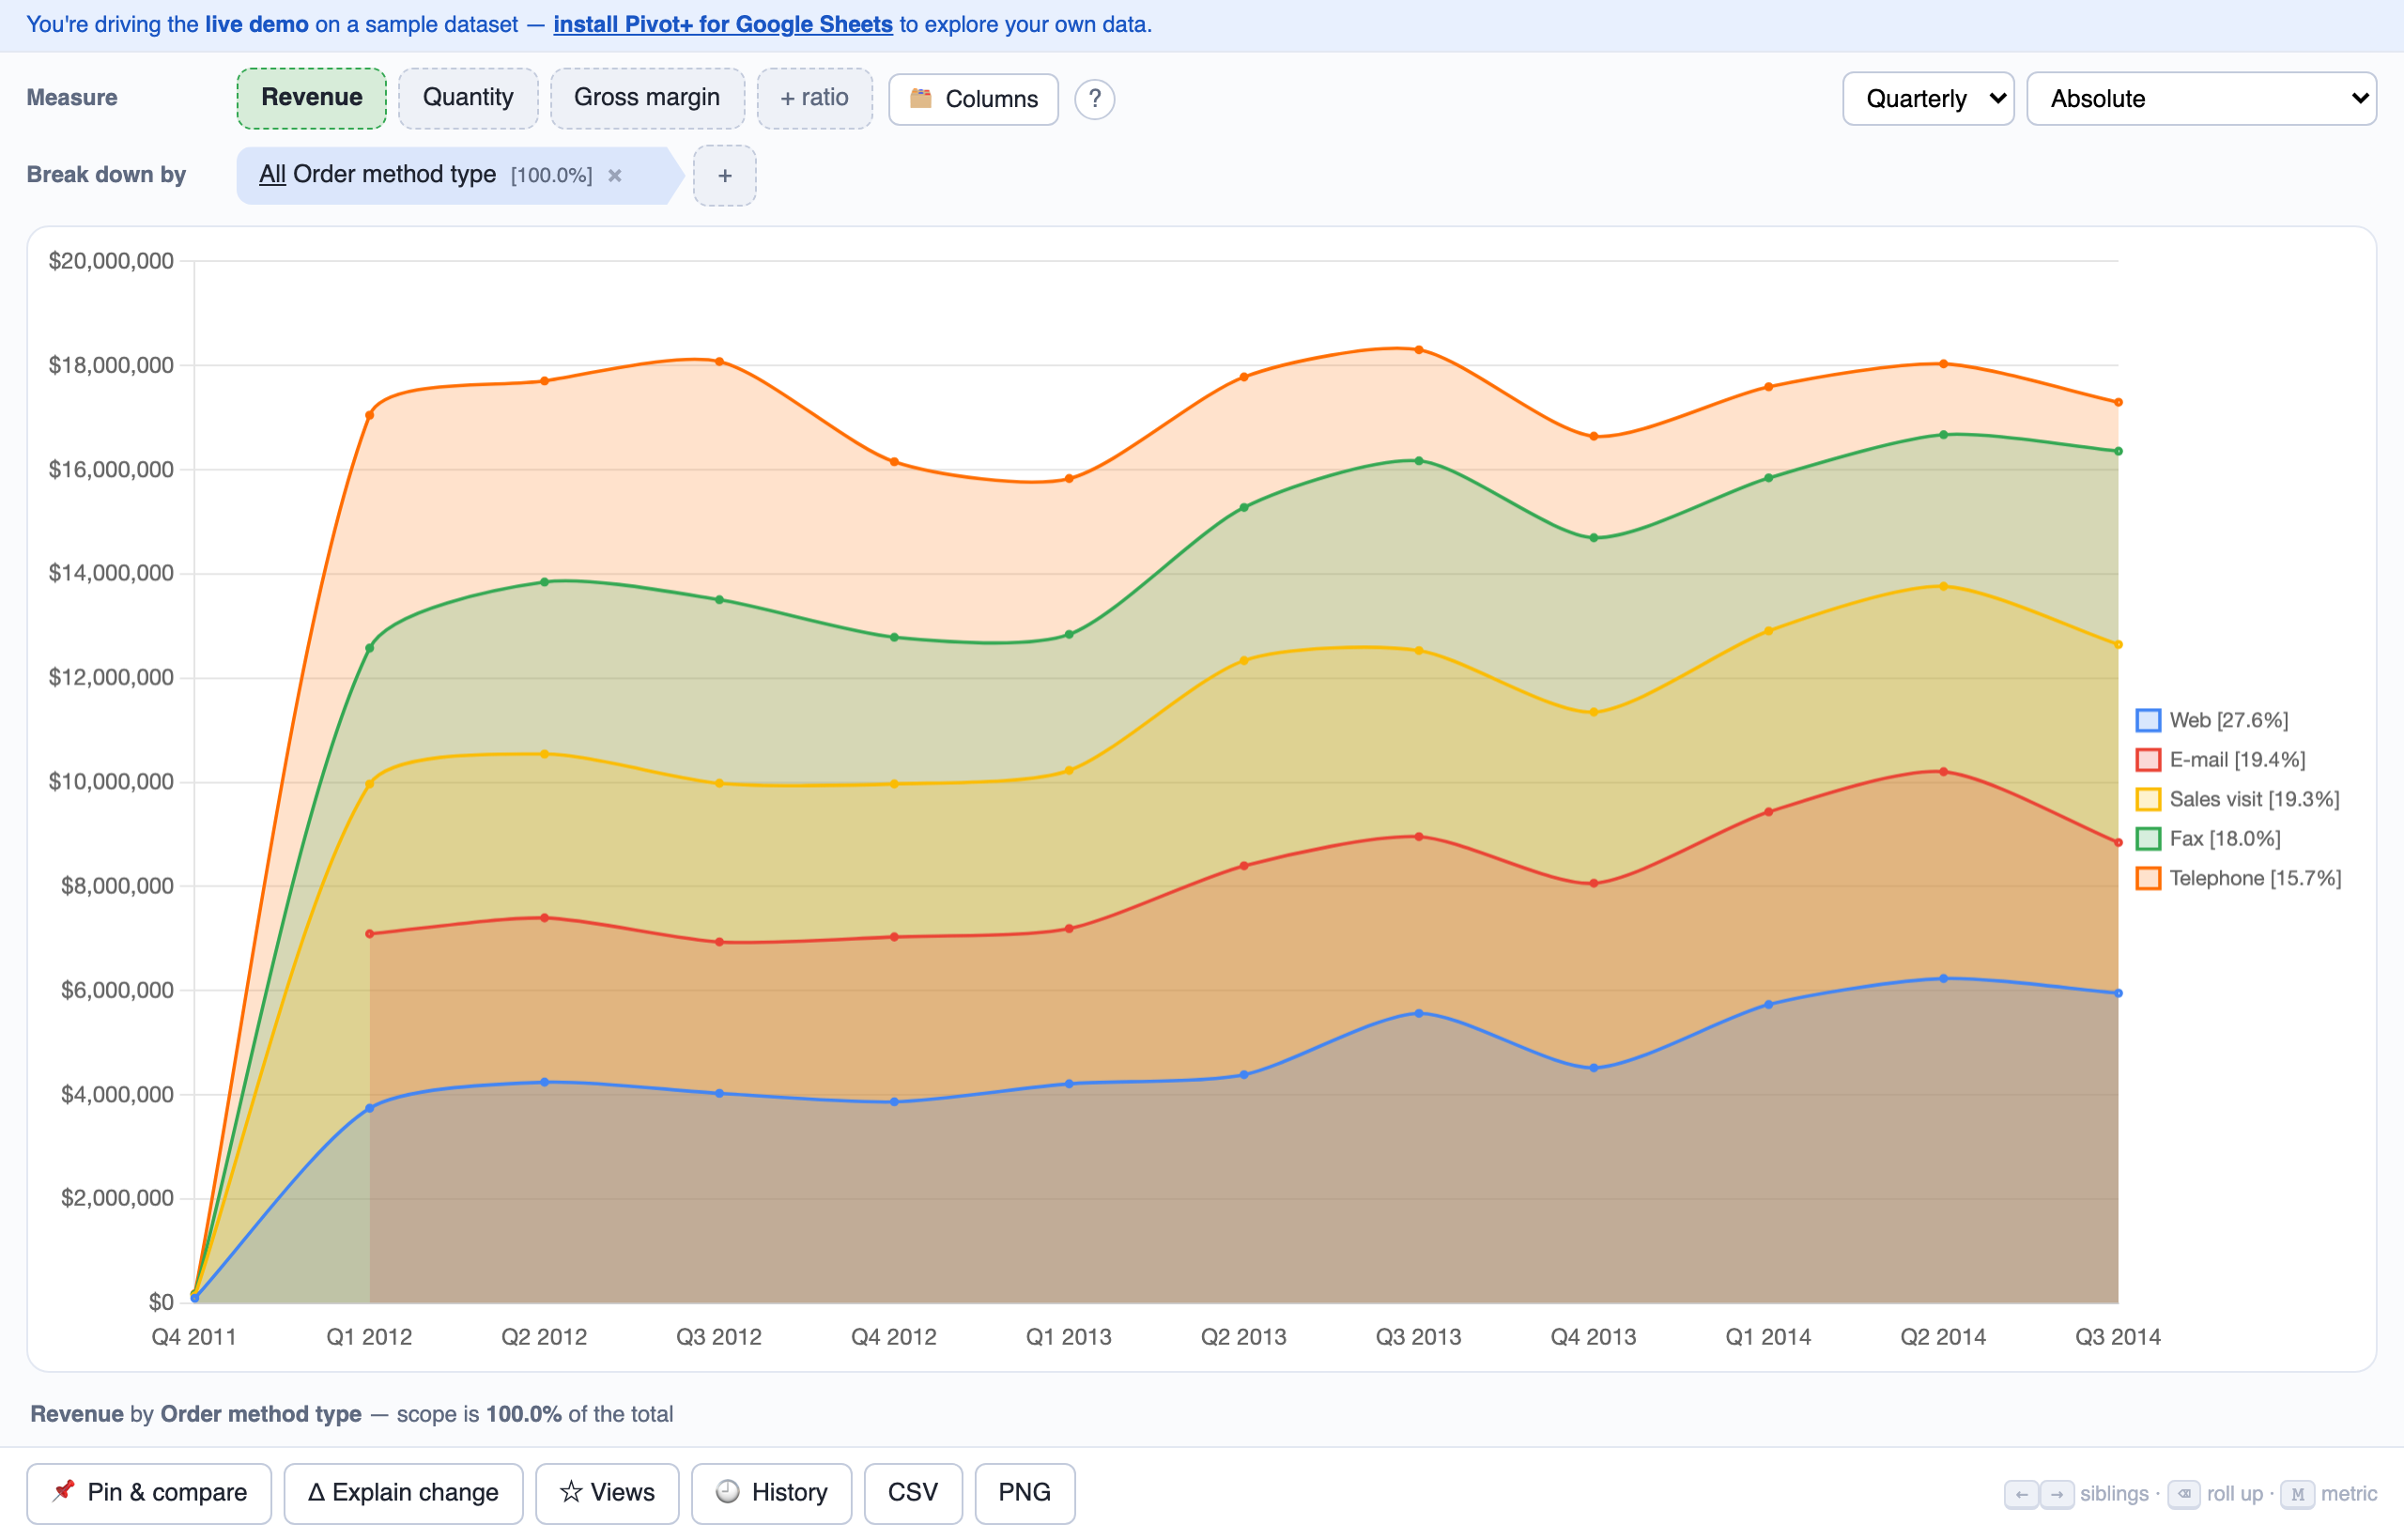
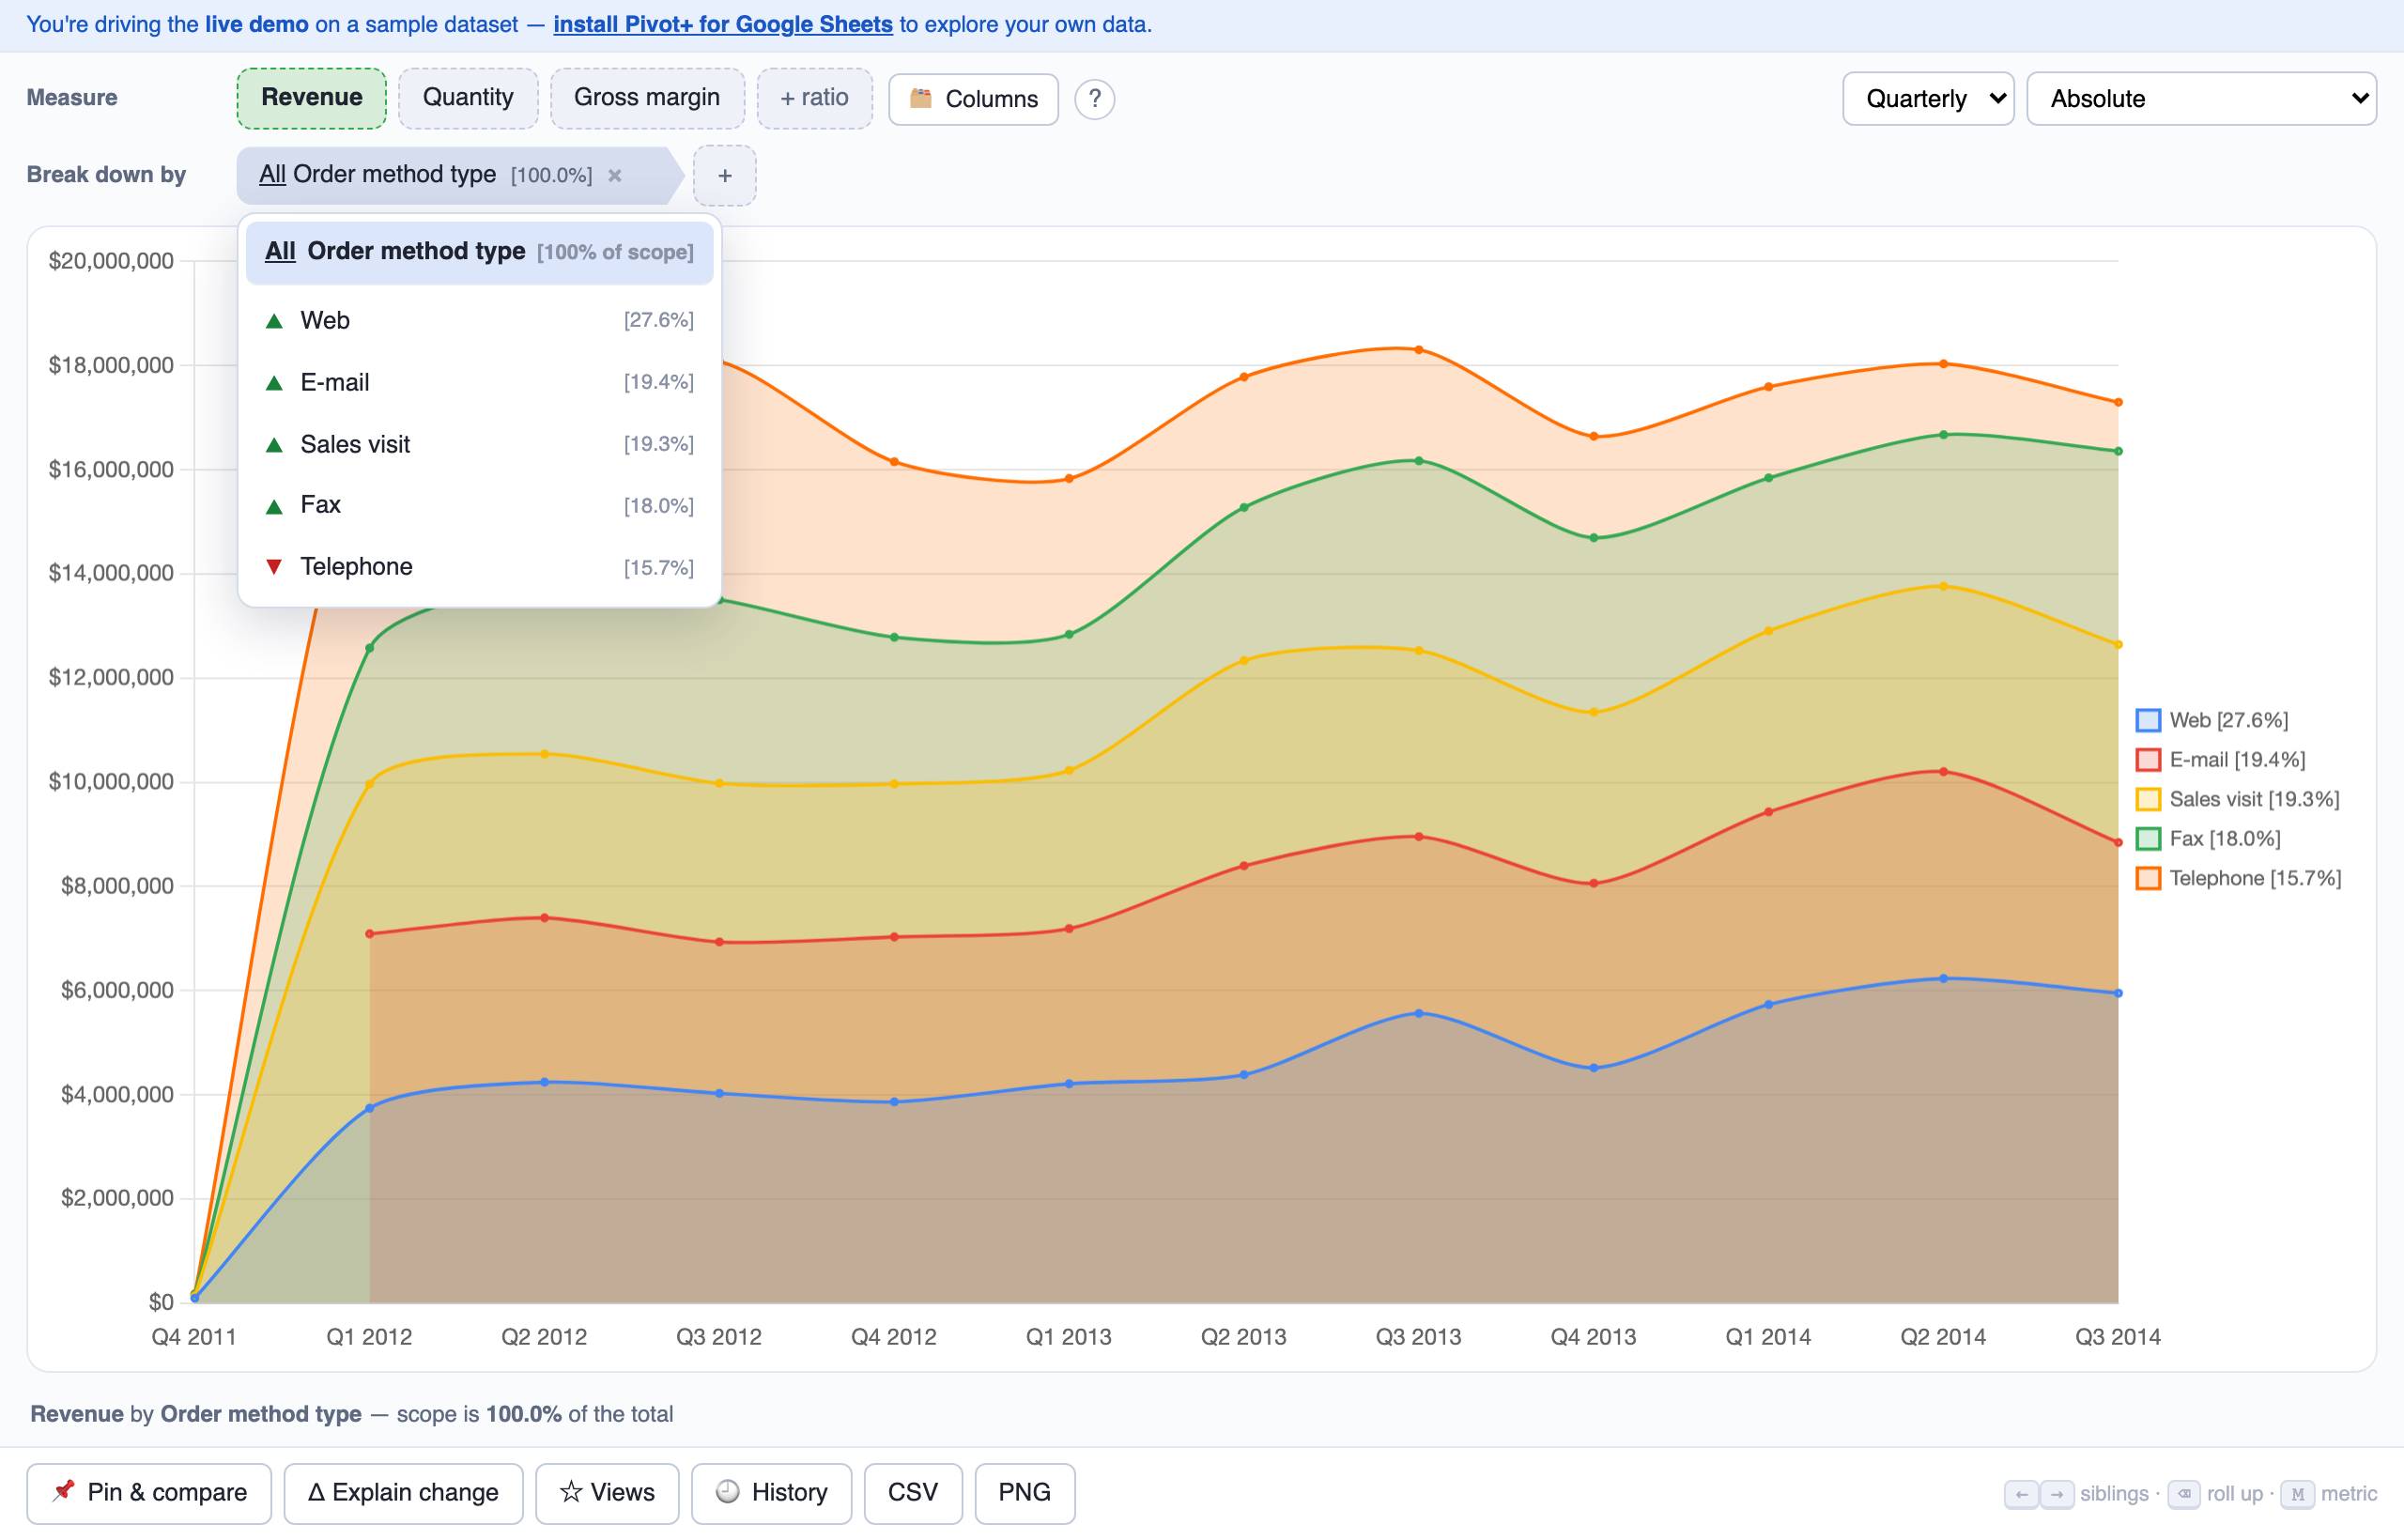
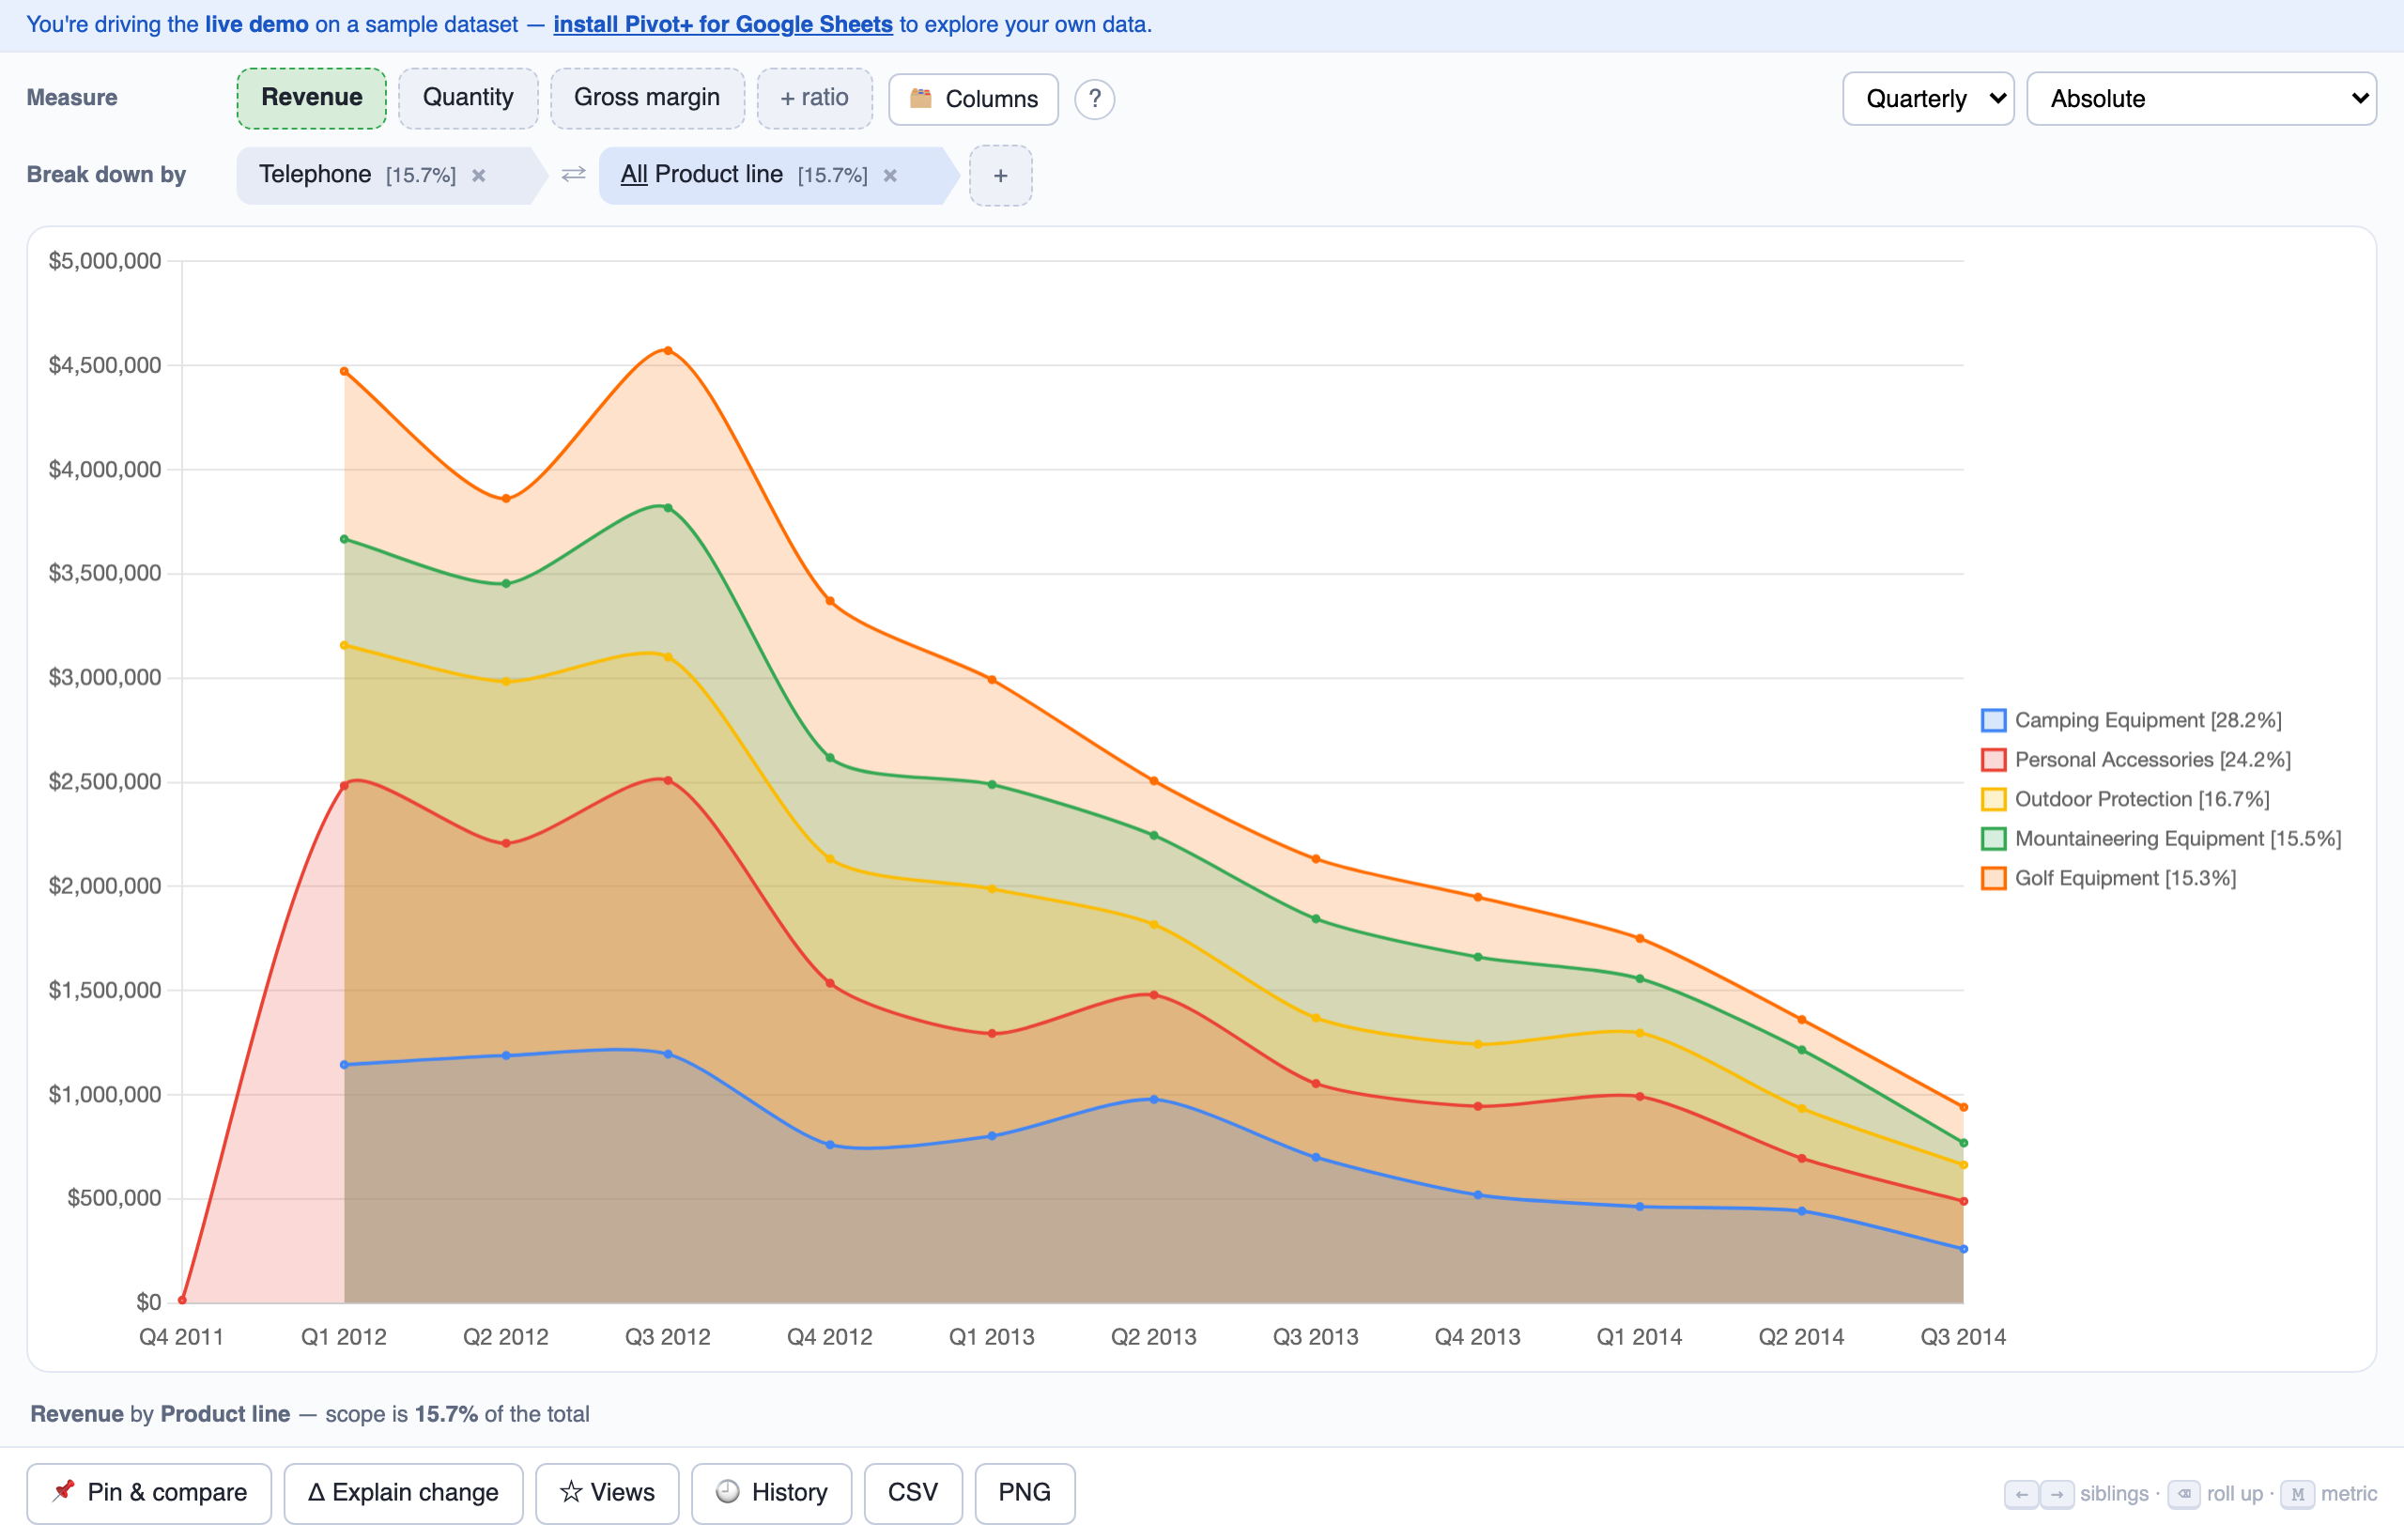
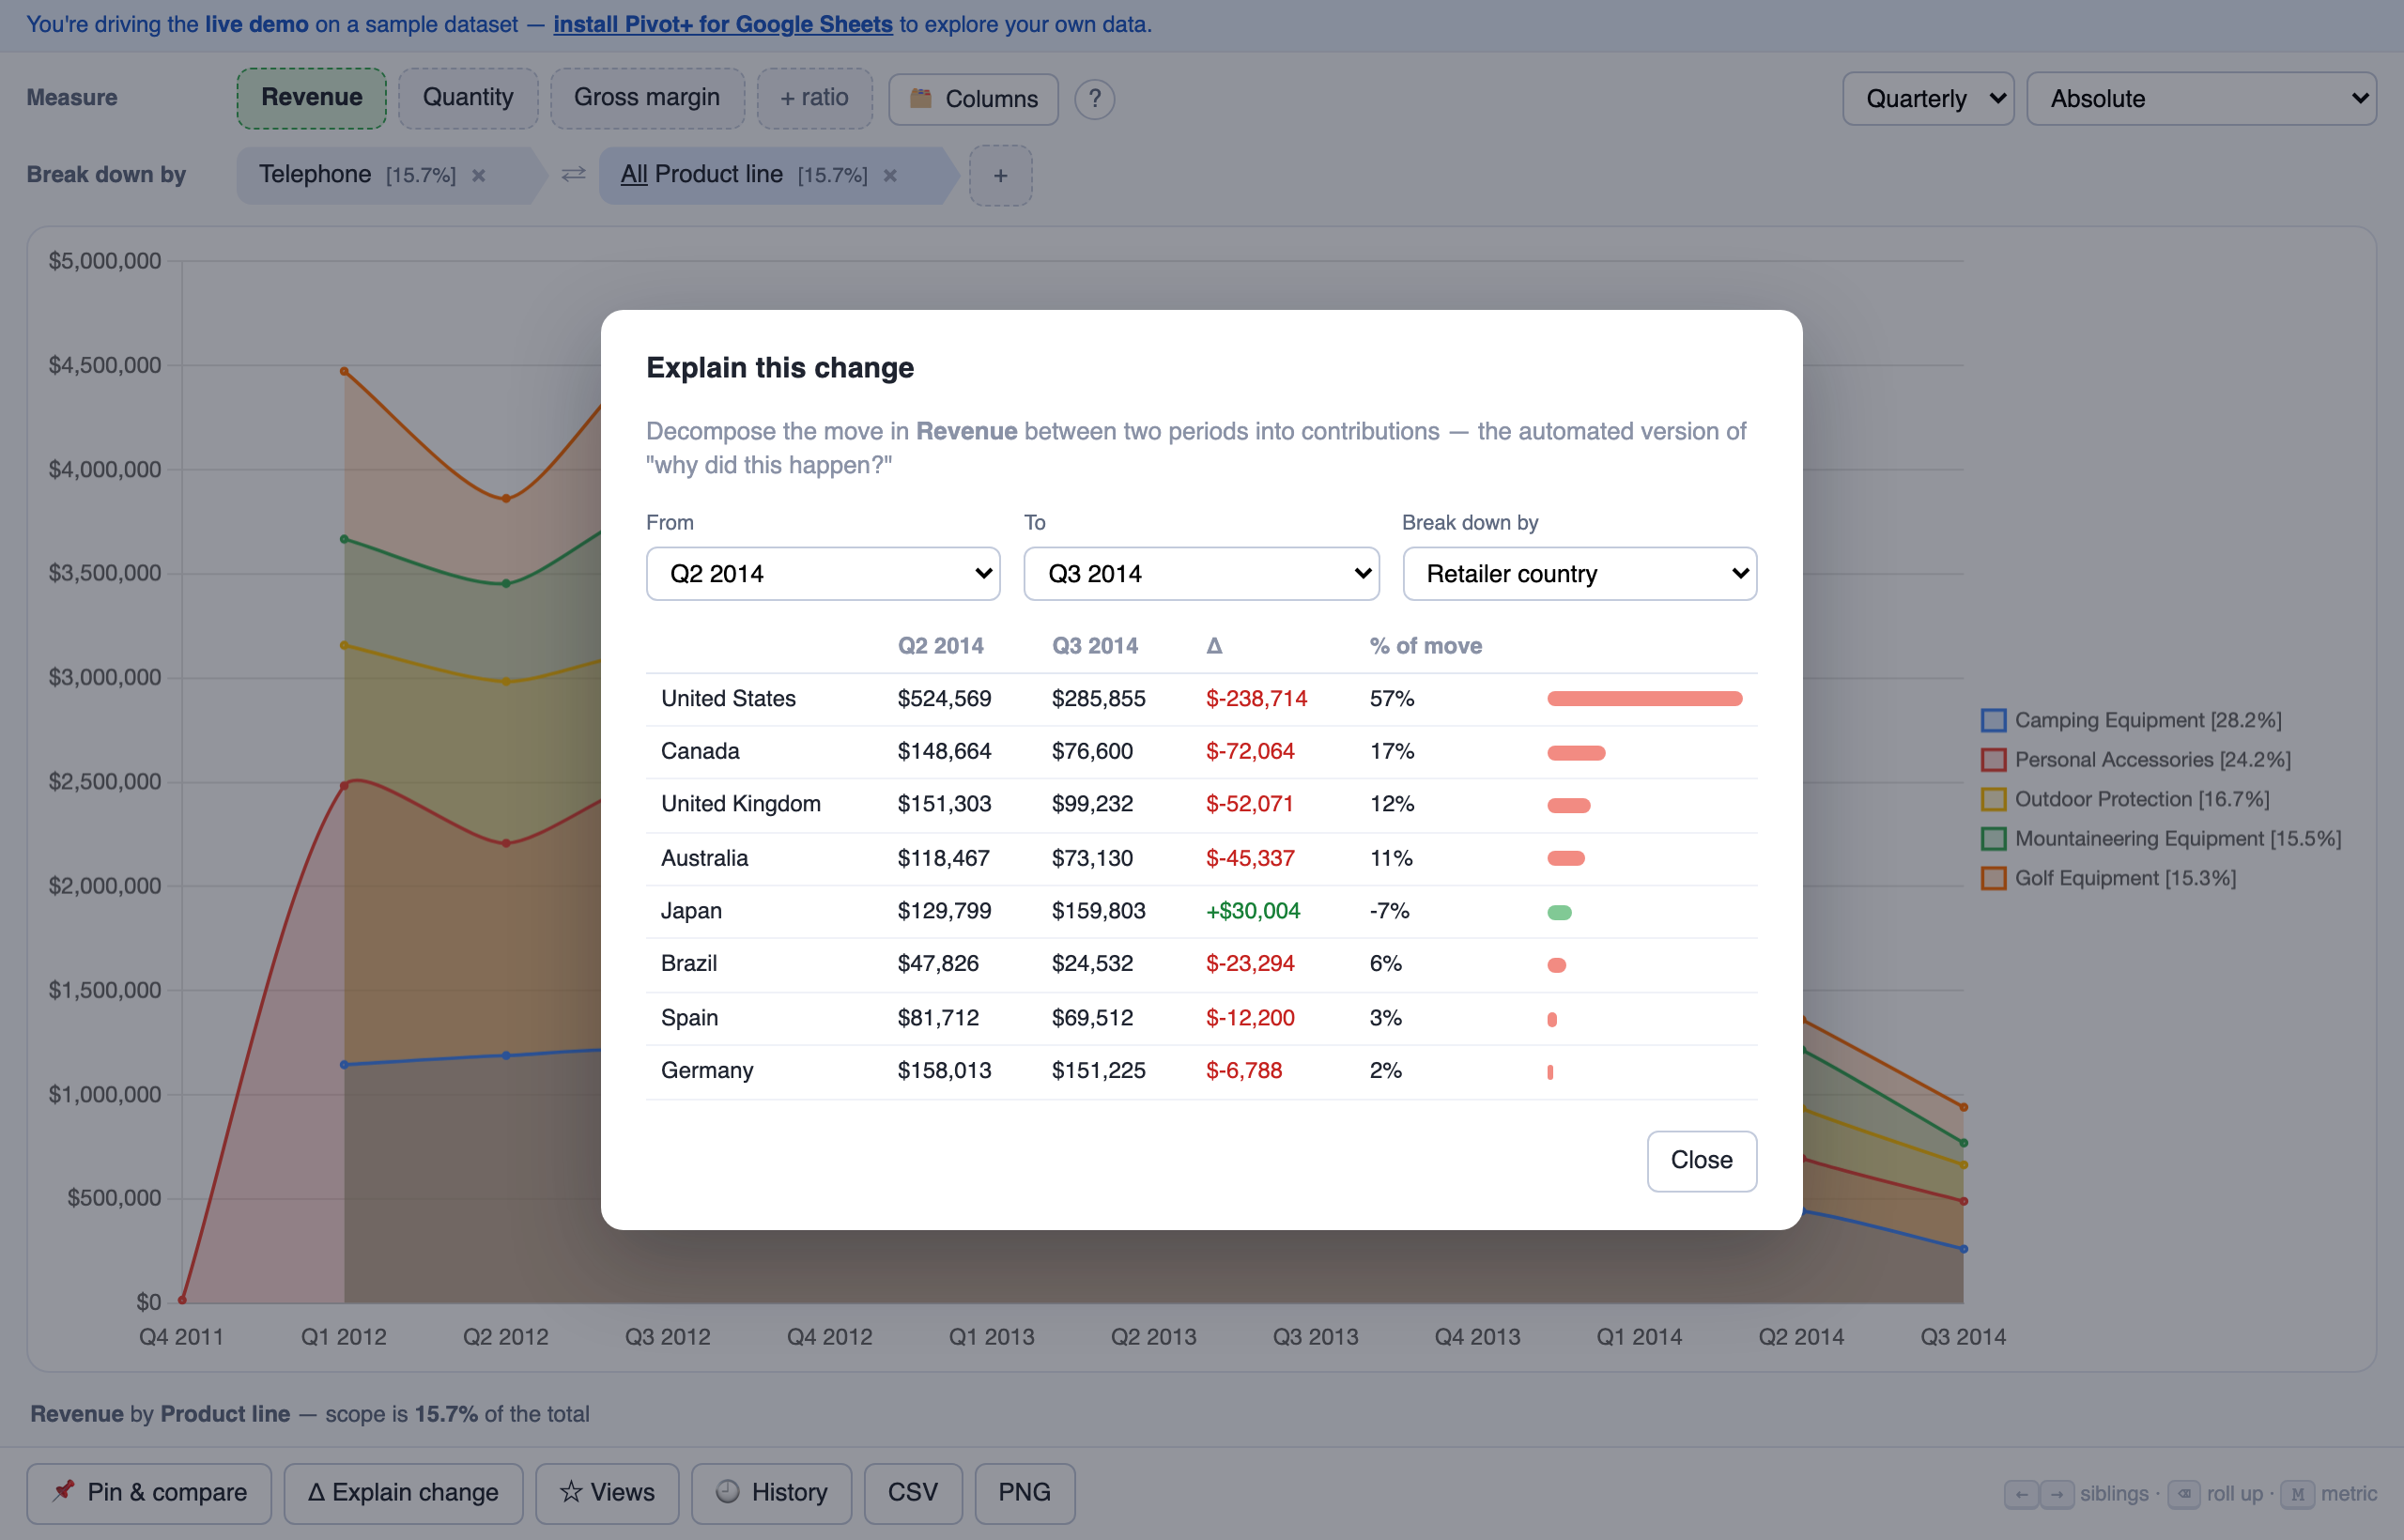
Chips are your question (Revenue → United States → Eyewear), and every view is a trend over time. Change the question by clicking, not rebuilding.
"Sales dipped, where?" is three clicks: by Region → France → by Product line. Pivot tables charge a rebuild per question; BI charges a dashboard project.
Columns auto-profile into measures and breakdowns. "Spend up, signups flat: which channel?" is Signups → by Channel. Works on Shopify, Stripe, CRM, and ads exports as-is.
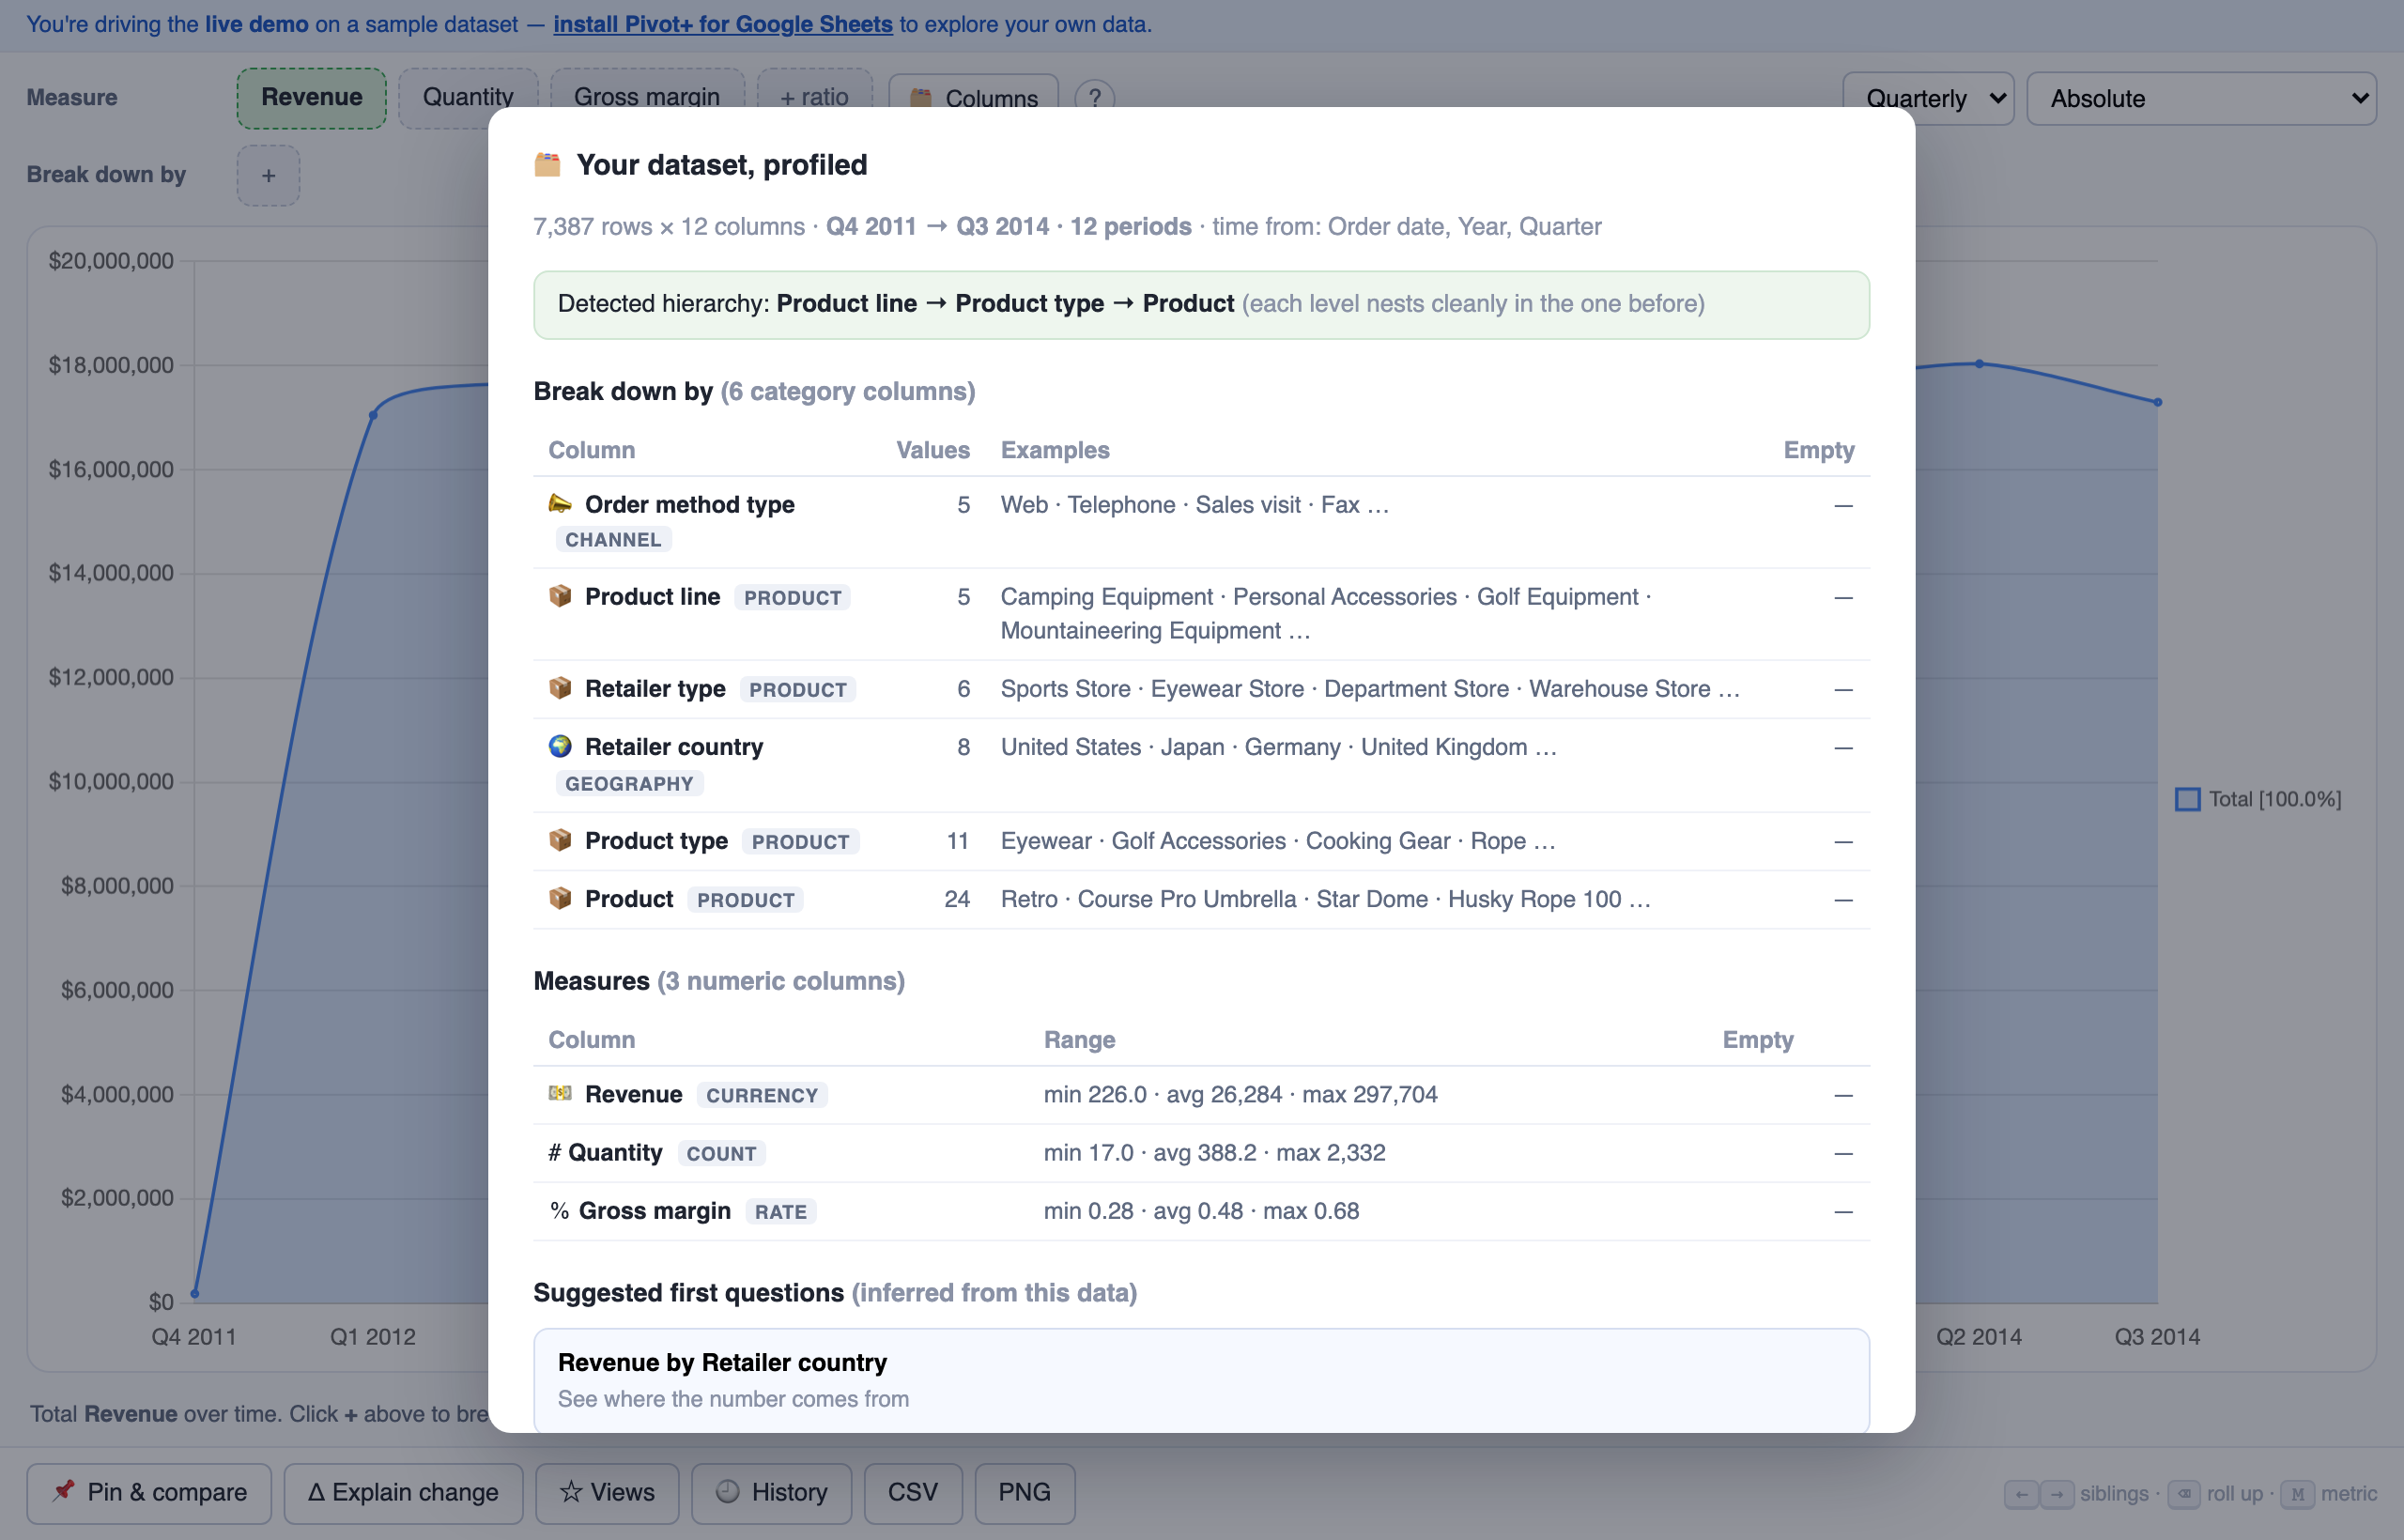
Open 🗂 Columns and Pivot+ profiles the whole dataset for you: every column tagged by what it means (geography, channel, product, currency, rate…), value ranges, empties, the timeline, and it detects drill hierarchies on its own, like Product line → Product type → Product.
Then it suggests where to start: questions inferred from your data's own trends: "Investigate Telephone: declining, 16% of Revenue". One click and you're exploring.
Sample data from the demo: 7,387 sales transactions. Question: "Revenue looks fine. Is anything quietly going wrong underneath?"
Each channel becomes a trend. Telephone is dying while the total grows, invisible in any yearly report.
Every value carries its share and a trend arrow. Telephone: [16.9%] and falling, worth your morning. At 0.4%, you'd move on.
Only phone orders now, by product line. The chips read like your question: Telephone → by Product line. Swap levels anytime with ⇄.
Pick two quarters → ranked contributions, in dollars and percent. The slide your CFO wants, one click instead of an afternoon.
You can't evaluate an answer about data you've never looked at. Judgment comes from knowing the shape of your business: what's big, what's normal, what moves together.
AI is only as good as the question you bring it. Sixty seconds of drilling is where the question worth asking comes from.
When a number matters, check it. Every figure in Pivot+ is a deterministic aggregation of your sheet: traceable, reproducible, zero hallucinations.
Let AI draft the report. Use Pivot+ to know whether the report is true.
Drill down, roll up, re-order; the view rebuilds in real time.
Yearly to daily. 100%-stacked and indexed modes.
Share-of-total on every chip and value. Skip the 0.3% branches.
Ratios, differences, averages (Revenue ÷ Quantity, net of costs) in two clicks.
Any move, decomposed into ranked contributions.
Save a session, come back to it, or pin a past one against today.
Columns tagged by meaning, hierarchies detected, starting questions suggested.
Declines, spikes, seasonality, mix shifts: found, ranked, root-caused, and explained.
All analysis runs in your browser, inside your Google session. No Pivot+ servers. No uploads. The add-on can only see the sheet it's open in.
The Marketplace listing is in review, but you don't have to wait. Pivot+ ships inside a template spreadsheet: copy it, and the add-on comes with the copy.
Want Pro unlocked for testing? The demo above already shows everything; early testers can ask for a demo key.
The demo is the full product on sample data, with no signup needed while the listing is in review.
Nowhere. Pivot+ reads only the spreadsheet it's open in (Google's narrowest spreadsheet permission) and does all the math in your browser. The only network call it ever makes is checking a Pro license key, never your data.
A pivot table answers one question per build. Pivot+ makes the question path the interface: every follow-up (drill, re-order, switch measure, check significance) is one click, and every view stays a time trend.
A flat table with a header row. Text columns become breakdowns, numbers become measures, dates (or Year + Quarter/Month) become the timeline, all detected automatically. There's a one-click sample dataset to play with.
Free explores the first 10,000 rows; Pro is comfortable at 300,000. Aggregation takes milliseconds; the practical limit is how fast Google Sheets hands over the data.
No. Charts export as PNG/CSV, and saved views live in the spreadsheet itself. Only the person doing Pro-level analysis needs Pro.
Then Sheets is the bottleneck, not Pivot+. A standalone version for millions of rows (CSV/Parquet, same interface) is on the roadmap; tell me you want it and you'll shape it.